Vancouver Weather Analysis: Beach Days per Year
How many days per year can you comfortably lounge at the beach in Vancouver, BC? We from the Pacific Northwest tend to be optimistic with weather and shed our clothing at the first hint of warmth, while those in equatorial climates have less need for such blind optimism.
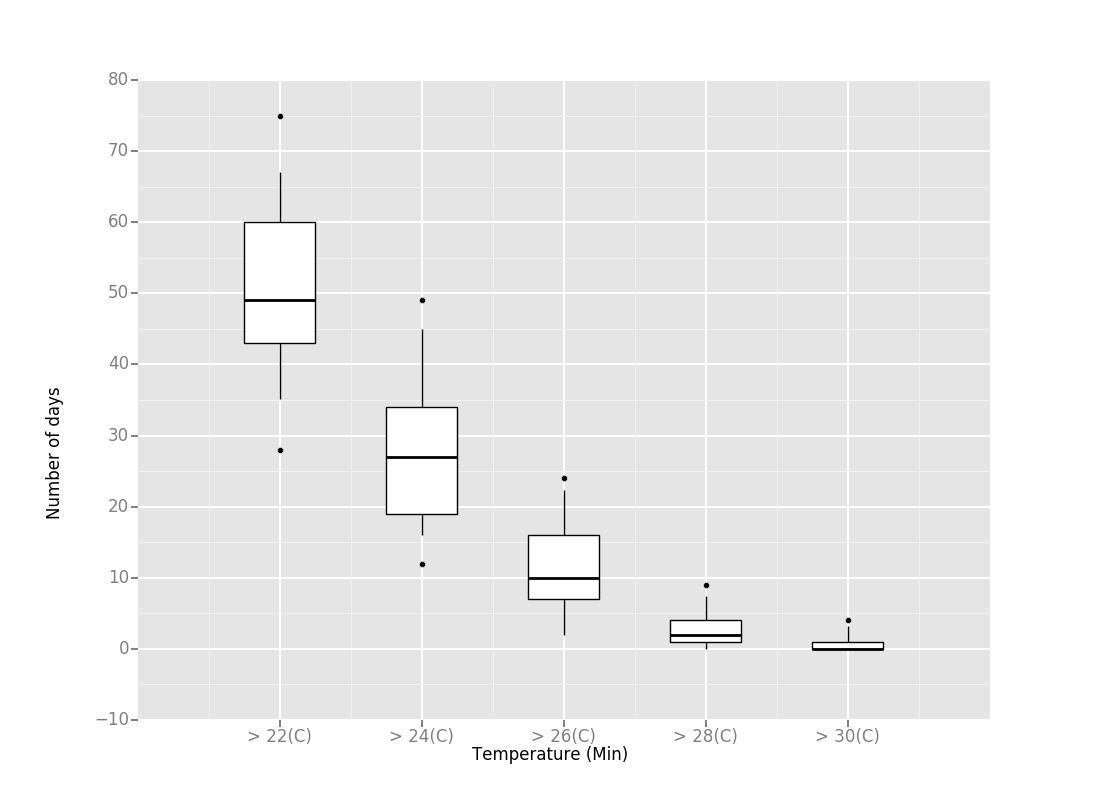
This analysis defines a “beach day” as any day without recorded rain and with temperatures above certain given thresholds. To accommodate a range of temperature tolerances the number of beach days is calculated for temperatures between 22C and 30C in 2C increments. Data is for years 2000 to 2016. Box plots show the average number of rainless days above the given thresholds. The reader is left to decide their place in the tolerance range.
My minimum beach-going temperature is 24 degrees and since 2000 there have been an average of 27 clothes-shedding beach lounging days per year. 2015 was an exceptionally warm outlier year with 49 such days. I don’t imagine we’ll be seeing one of those again soon.
Data Sources
Weather is collected from the Government of Canada historical weather and climate website. The data collected for this analysis was from the Vancouver Harbor Weather Station, aggregated at daily grain from Jan 1st, 2000.